

Changelog Nov 3, 2026 - Reorder your scan columns, and latest results on saved scans
Drag scan result columns into the order you want and keep it. My Scans shows what each saved scan found last. Plus fixes for the Charts view and the alert composer.
 Eoin2 min de lectura
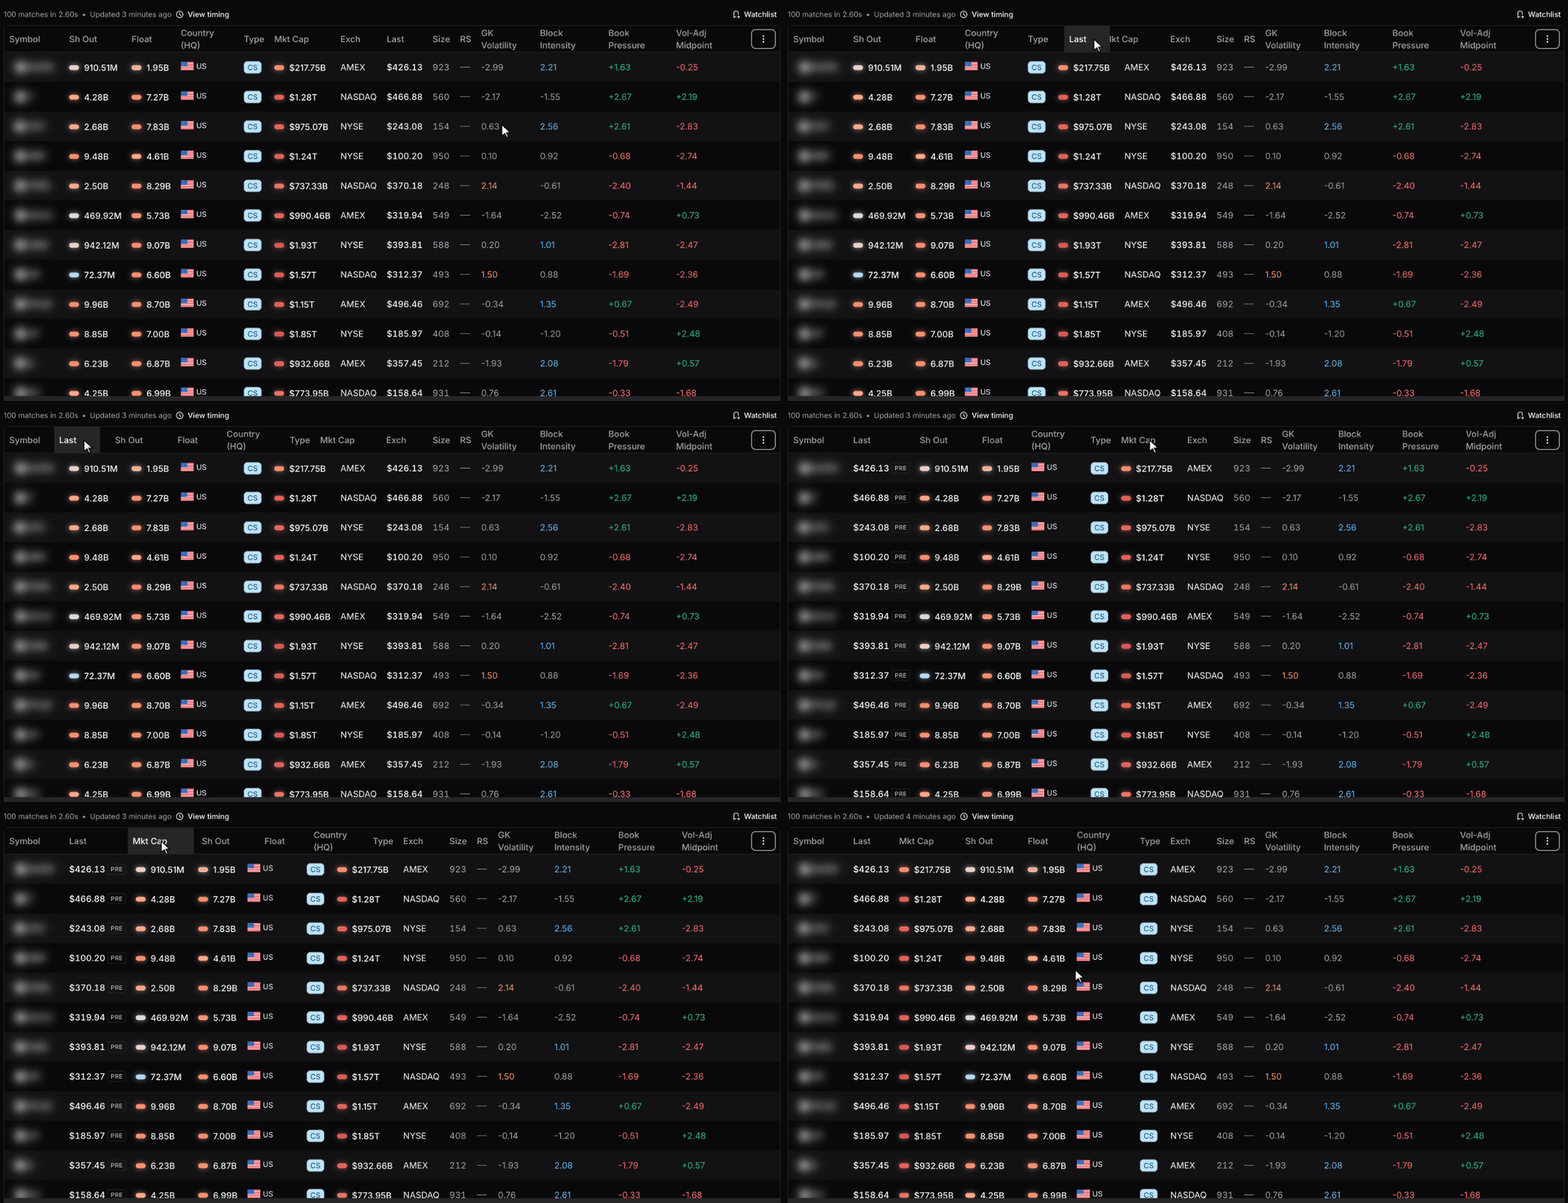
This release is mostly fixes, for the scan Charts view and the alert composer. It also adds two things to the web app: you can rearrange the columns in your scan results, and My Scans shows what each saved scan found on its last run.
Rearrange your scan result columns
Drag a column header left or right to move that column. Symbol stays first and the ⋮ column menu stays at the right end. Your browser keeps the order, along with the columns you showed or hid from the menu, so the grid looks the same the next time you scan. To start over, open ⋮ and click Reset column order.
Dragging moves columns, and the rows keep the scan's sort order. To sort, open the gear next to Scan and pick a field under Sort. The layout lives in one browser, so a second computer starts with the default columns.
Latest results on your saved scans
My Scans has a new Latest Results column. Each saved scan shows up to five tickers from its most recent run, with their logos and a +N for the rest. Click a ticker to open its page. The Load dialog in the scanner shows the same column, so you can see what a scan found before you load it.
Also in this release
- The scan Charts view could freeze the browser tab right after a scan. It doesn't anymore.
- Switching the Charts view to 24, 50 or 100 cards a page now draws every card. Before, cards after the twelfth stayed on their loading placeholder until you reloaded.
- With a chart pattern filter in your scan, the Charts and Overview views draw the matched pattern on every card. Cards could leave out an older match, and a card showed only its last 50 bars. Now a card opens up to 120 bars back to frame the latest pattern. Auto overlays in the chart settings has to be on Smart or All. A pattern with a missing point no longer crashes the scan page.
- The alert composer now uses the price of the ticker you pick. It used to keep the first ticker's price, so the "now" price, the presets and the preview showed the wrong numbers. You can also drag a level, or either end of a range, up or down the composer's chart to change it.
- The first time you turn on Training mode on a chart, a five-step tour shows you how to frame a window and train a pattern model. Pattern models are part of Super and Super Pro.
- In Alerts > Routing, the "Why didn't it fire?" list scrolls inside its panel instead of stretching the page. Click a row's alert to edit it.
Tell us what you'd like next, or anything you run into, at feedback.scanr.ai or [email protected].
— Eoin & The Scanr.ai team