

Changelog Sep 13, 2026 - Chart drawing, ETF pages, and theme strength
Draw on any ticker chart and export it as a PNG, open a fund and get a page built for funds on web and mobile, and rank correlation themes by strength on a new dashboard card.
 Eoin4 min read
The ticker chart takes your own marks now, and exports what you drew. Funds get a page built for funds, on the web and in the app. And a new dashboard card ranks correlation themes by strength rather than by yesterday's move.
Draw on the chart, then share it
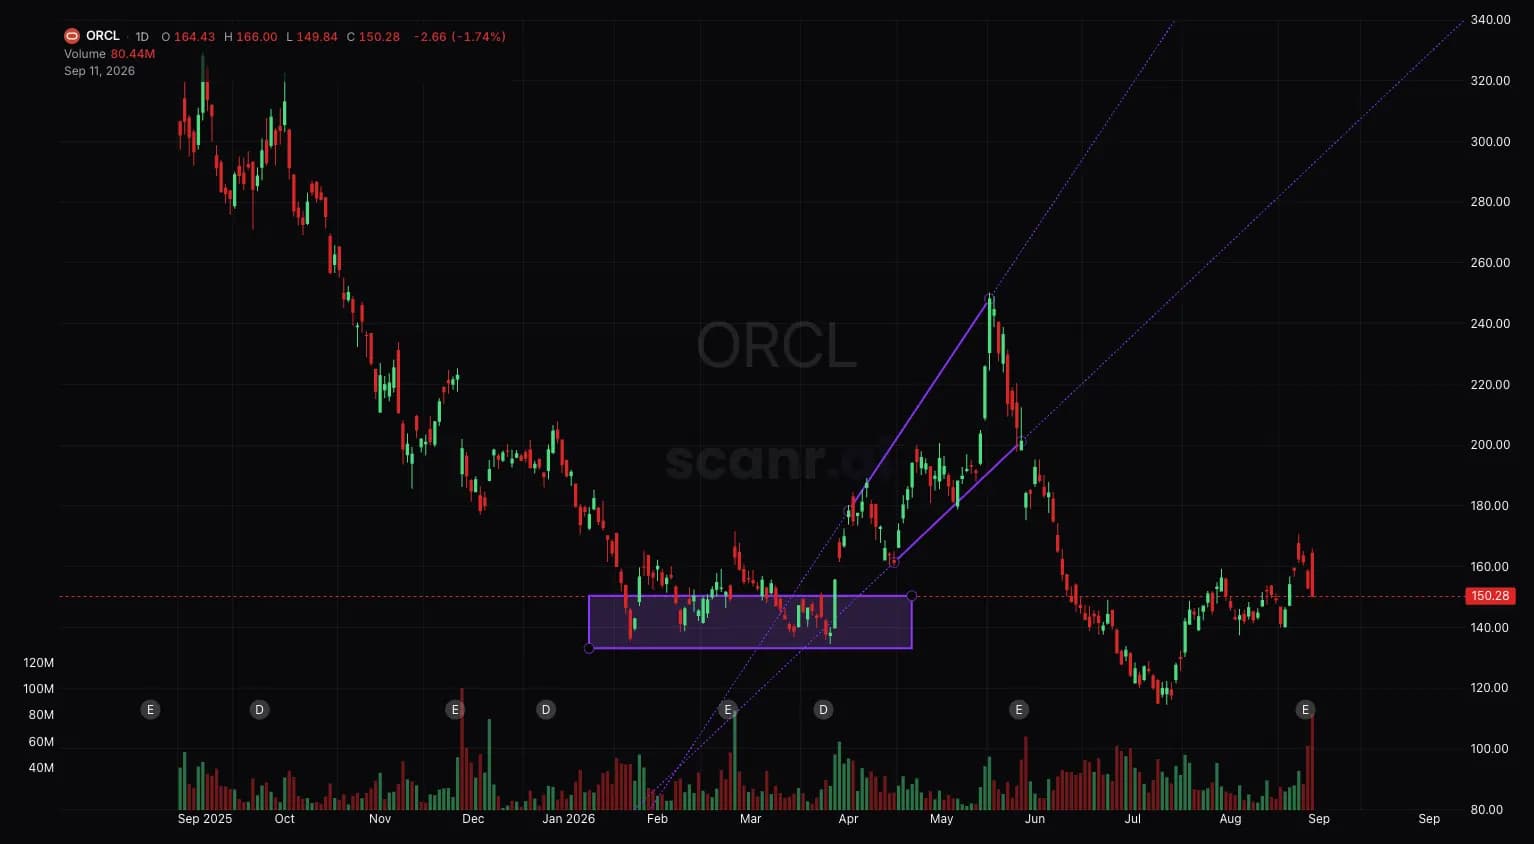
Eight tools sit above every ticker chart: trend line, horizontal line, horizontal ray, vertical line, rectangle, Fibonacci retracement, callout and label. Drag a grip to move a mark, right-click it for colour, width and dash style, or reach for the eraser. Marks save against the ticker as you draw, so a level you put on NVDA in March is still on it in June.
Export chart renders a PNG of the chart as it stands: candles, indicators, your drawings and the legend. Crop it, then copy or download. Export works signed out. Saving drawings needs an account, since they are stored against yours. Web only for now.
ETFs get a page built for funds
Open a fund and the page changes shape. A fund identity panel replaces the company one, holdings arrive as a weighted treemap over a sortable table, and an industry breakdown sits under them alongside payout history and short interest. The app's tabs change with it: Overview, Holdings, Payouts, News. Fundamentals and peers are gone for funds, because 1 of 6,148 funds carries a fundamentals row and none carry peers.
Cell size on the holdings map is always the weight, and nothing changes that. Colour is the free channel: Weight gives each position its own colour, Performance shades by price change over a lookback you pick — today out to a year — Rel. volume by how far today's volume sits from that constituent's own 60-day average in standard deviations, and RSI by the 14-period reading. Each scale brings its own legend, and a holding we have no reading for stays a flat neutral instead of colouring as a middling one.
Before you open SPY: holdings cover sector and thematic funds, so SPY, QQQ, IWM and DIA report none and say why rather than drawing an empty table. And the constituents we hold sum to about 80% of a typical fund, so the treemap carries a greyed Not covered slice instead of inflating the names we do have.
Constituent rows need Super or Super Pro, and the colour channel rides with them, since it is a reading per constituent. What we derive from them stays free: the industry breakdown, the holdings count, the snapshot date and the top-holdings concentration.
Which themes are strong, not just which moved
Theme Overview is a new dashboard card on web and in the app. Each row is a correlation theme carrying its average relative strength, a 20-session slope, how many members scored, a trend spark and performance. Sort by any of them.
The level reads today's membership. The slope holds the basket fixed across its window, so a theme cannot read as fading because we reclassified it last week. A theme with no reading sinks to the bottom in both sort directions rather than counting as a zero. Relative strength needs a paid plan; free accounts keep the performance columns.
On a phone the column names double as chips: tap one to sort, hold it for what it measures, tap a row for its coverage and the slope's fit.
Filter a scan by country of domicile
Country (HQ) joins Exchange, Type and Theme in the universe picker, on web and in the app, free on every plan. The label names HQ country because that is what the value is: Southern Copper is US-domiciled with every mine in South America.
Coverage is thin today. About a sixth of the active universe carries a resolved domicile; the rest sits under Unknown, including every ETF, which has no issuer domicile to carry. Unknown is pinned above the list and selected by default, and deselecting it raises a warning with a one-click fix, since a country selection without it drops every fund from your scan. Leaving Country alone restricts nothing.
Prompt boxes you can write in
The plain-English scan boxes were two-line textareas that scrolled anything longer and left your markdown as literal asterisks. They are one editor now, formatting as you type, growing to about fourteen rows, and parsing markdown you paste in from elsewhere, tables included. Enter is a newline that continues a list; Ctrl+Enter, or Cmd+Enter on a Mac, runs the scan. Pressing Enter after a bullet used to fire a metered AI scan instead of giving you the next bullet.
Also in this release
- Loading an official preset scanner seeds its latest run instead of emptying the grid. It reads a stored run, so it costs nothing against your daily scans.
- Ask the AI for a filter your plan does not include and you get the row, locked. It used to delete that filter and run without it, telling you nothing.
- In the AI terminal, asking to run a saved scan by name loads the stored payload rather than retyping it, so no filter goes missing on the way.
- A saved scan can no longer adopt a scan run that belongs to somebody else, and the pricing plan highlights lost their duplicates.
The drawing tools are the ones we most want to hear about. feedback.scanr.ai or [email protected].
— Eoin & The Scanr.ai team