



Changelog Oct 17, 2026 - Holiday themes, market holiday warnings, and value-colored indicators
Scanr.ai now dresses itself for Halloween, Thanksgiving, Christmas, New Year and the Fourth of July, warns you before the market closes early, and colors indicator panes by their reading.
 Eoin3 min read
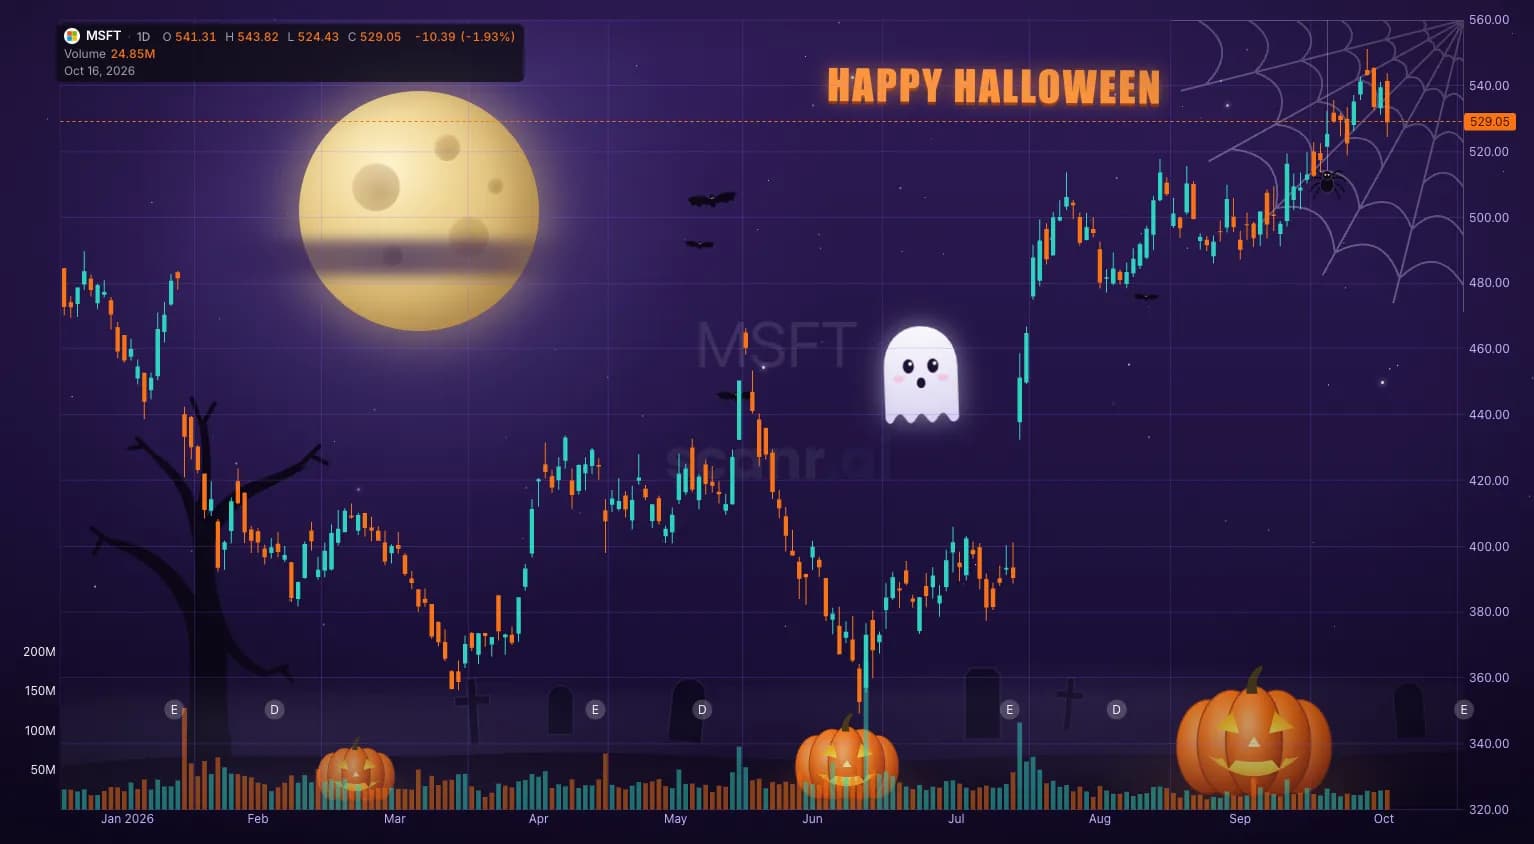
Scanr.ai now changes with the calendar. Halloween is live today, charts and indicator panes show more of what they measure, and a banner tells you when the market closes early. Everything below is on for every plan unless noted.
Holiday themes
The app follows one New York-date calendar for five seasons: Halloween, Thanksgiving, Christmas, New Year and the Fourth of July. Web and mobile switch on the same day. The Halloween window opened on October 16.
In season you get:
- A holiday logo in the header and footer, a seasonal favicon, share cards and email headers.
- Stock charts in the season's palette whenever the chart theme is set to Auto. The ticker page and the trade outcomes chart add a full scene, with snowcaps at Christmas and confetti at New Year. Chart settings switch the scene off. Pick any other chart theme and nothing changes.
- Seasonal loaders, empty-state art, a dashboard greeting and seasonal art on the 404 page.
- On mobile, seasonal pull-to-refresh, an accent on the active tab and a Holiday decorations switch for the chart scene.
Prices, data and scan results never change with the season. Turn the whole thing off with the Holiday themes switch on your account page.
A New Year recap arrives with the New Year window, December 31 to January 14. It's a shareable story of your year on Scanr.ai, built from your scan activity, on web and mobile. Scan history only keeps 30 days, so the 2026 recap counts from the day we started tallying runs and says so.
Warnings before the market closes early
A dismissible banner on the dashboard, the scanner and the ticker page tells you when the market is closed or closes at 1pm ET. It shows the day before and on the day, on web and mobile.
Indicators that show their reading
RSI, Stochastic, Williams %R, CCI, MACD, ADX, relative volume, squeeze, ATR and 20 more indicator panes now color their main line by where the value sits on the Market State scale. RSI gets its 30 and 70 zones. Indicators with a natural scale keep fixed axes, so a reading looks the same from one chart to the next. Secondary lines keep their own colors.

The auto chart overlays setting also has a new default, Smart. It draws a budgeted set of overlays picked to look different from each other: two on the price panel and one shared lower panel. All and Off are still there. Cross presets now draw both sides of the comparison.
Also in this release
- The Theme Solar System marks sharp months with a solar flare, UFO invasion, asteroid impact or neutron star, and the timeline plays at 1x to 8x.
- A Themes dashboard preset puts the theme overview, scatter, stacked bar and river charts on one page. The Market Overview preset adds the overview too.
- The market breadth history chart no longer lags when you hover on Max.
- The AI terminal stops telling you a button is below its reply when the button sits above.
- The nav and footer Changelog links now open the changelog posts on this blog.
Tell us which season you want next, or anything else you run into, at feedback.scanr.ai or [email protected].
— Eoin & The Scanr.ai team