

Changelog Aug 27, 2026 - Theme History, the Squeeze, and 12 new indicators
The Theme History card becomes a 3D heatmap, the chart study catalogue goes from 69 to 81, and you can save any scan's results straight to a watchlist.
 Eoin4 min read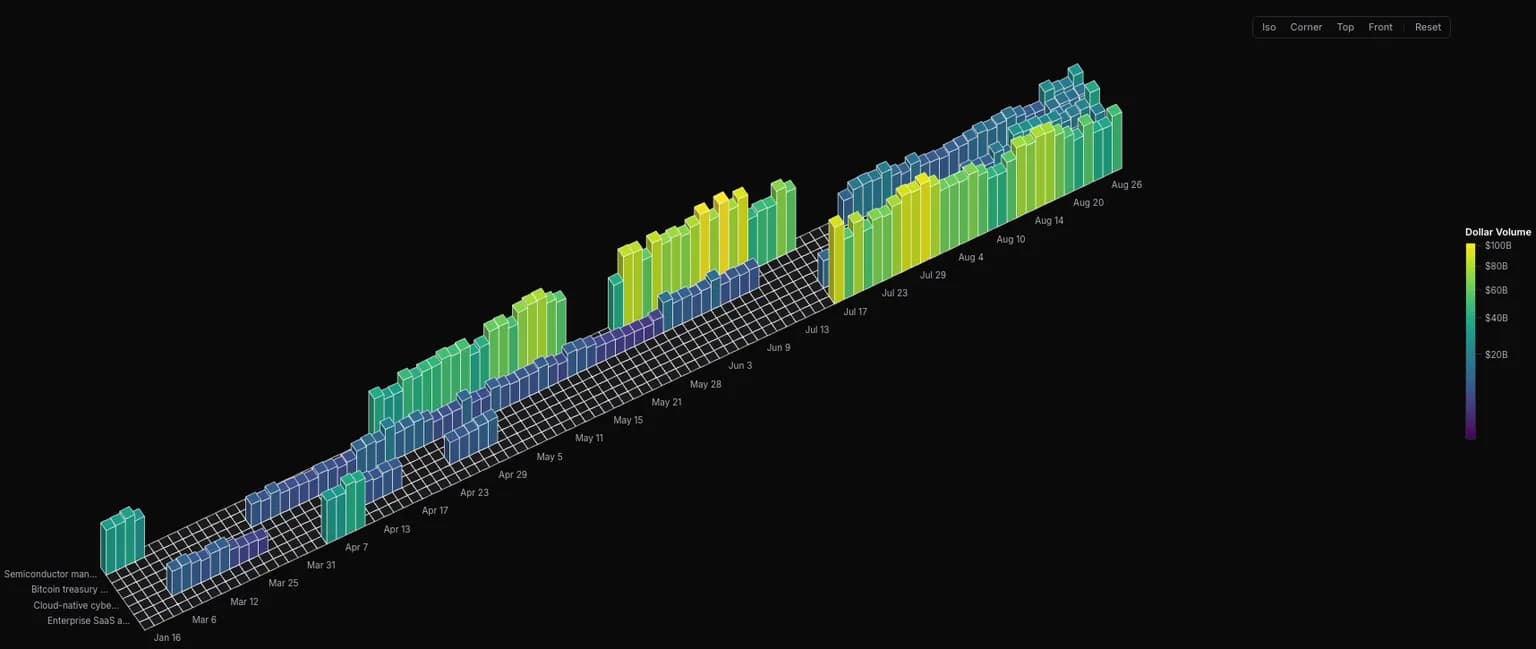
Two charts changed shape this release, and twelve new chart indicators arrived.
Theme History
The Theme Volume card is now Theme History, and it draws as a 3D heatmap. Every cell is a theme on a date, with colour and height both carrying its dollar volume, so a week where money crowded into one theme stands up off the grid instead of shading a fraction darker.
Four camera presets sit above the chart. Iso and Corner give you the oblique view, Front flattens it into a wall, and Top drops you back to a plain 2D heatmap when the extrusion gets in the way of reading a single row. Reset takes you home.
Twelve new studies
The catalogue goes from 69 studies to 81, in two new groups and a handful of additions to the old ones. Price studies cover average, median, typical and weighted close price. Cycle studies bring the five Hilbert Transform decompositions: dominant cycle period, dominant cycle phase, phasor components, sine wave and trend-vs-cycle mode. Alongside those you get average daily range, directional relative volume, and the Squeeze.
Save a scan's results as a watchlist
Run a scan, then mint a watchlist from what came back, from the stats row or the ellipsis menu. The tickers copy in once. The list does not follow the scan afterwards, and the dialog tells you that before you commit to it.
There is no second button for putting the scan itself on your dashboard, because a saved scan is already there: the dashboard card's source picker lists saved scans, and that card re-reads the scan every time it loads.
One more scanner addition worth knowing about: the Unusual Volume preset finds stocks trading more than three standard deviations above their own 60-session average, among names that already turn over $10M a day. A mega-cap and a small-cap clear the same statistical bar, and the study measures that volume arrived rather than which way price went.
Also in this release
- Dragging a stock filter into another group keeps its threshold. It used to reset to the reference default, turning "> 15" into "> 0".
- Renaming a saved scan renames it. Web and mobile both used to write a second row and strand the original's tags and history on the first.
- Filter thresholds over 100,000 read as 500M rather than 500000000, and only where rounding cannot misrepresent the number you set.
- The "As of" badge on My Scans lights up for frozen anchors only. A rolling anchor refreshes and alerts like any other saved scan.
- Scan-refresh toasts name the scan and offer to open it.
- Chart pattern thumbnails draw as real candlesticks from labelled price windows, on taller tiles that no longer flatten steep patterns.
- Filter rows collapse their controls as the drawer narrows, and the child bars-ago input moved inline beside the others (web).
- $TICKER mentions in AI terminal replies are tappable (mobile).
- Old confirm-signup links land you signed in. They used to show an error while the browser completed the exchange behind them.
- A tab left open across a deploy reloads itself instead of crashing on a chunk that no longer exists.
- Pricing opens on monthly billing.
- Sidebar tooltips stopped clipping against the collapsed rail.
Tell us what breaks, especially on the new studies. feedback.scanr.ai or [email protected].
— Eoin & The Scanr.ai team