



How 5,700 stocks sort themselves into themes every Sunday
Every Sunday we rebuild our theme map from a year of prices: the math finds the groups, a language model names them, and every member gets a grade.
 Eoin17 min read


By its industry code, Centrus Energy is a miner. Oklo is a utility, coded the same as Vistra, and NuScale sits under fabricated products. Put their charts side by side and you would struggle to tell them apart, because all three trade on one story: the next generation of nuclear reactors. An industry code records the business a company reports. A trader cares about the crowd that buys the stock, and that crowd is what a Scanr.ai theme describes.
Every Sunday at 06:00 New York time we rebuild the theme map of the US market from scratch, from about 5,700 stocks and a year of daily prices, with no hand-picked members. The math decides which stocks belong together. A language model then names each group from a fixed list of 73 themes, and we grade every member Core, Satellite or Loose by how tightly it trades with the group. Out come nearly 200 themes and about 5,000 graded memberships, priced live every 30 seconds while the market is open.
The machine above has one station for each step of that rebuild, in order: drag it round to bring a step to the brass index. Below is every step in detail, with figures drawn from a replay of the real pipeline, and the end of the post shows the map that comes out.
Why we start from prices
The theme lists we found for retail traders are mostly written by editors, or built from the words companies use: keyword matches in filings, revenue by segment, an analyst's call. Those methods describe what a company says it does. Text-based ones can pick up a company that talks about a theme, and an edited list waits for someone to add a stock the market already trades as part of one.
We wanted the opposite order: find the groups that move together first, then ask what they have in common. The idea is old. In 1999 Rosario Mantegna built a tree of US stocks from their correlations, and its branches lined up with industry sectors (Mantegna, 1999). It also has a known weakness. Groups built from returns drift, and a 2007 study found them less stable out of sample than industry codes (Chan, Lakonishok and Swaminathan, 2007). Much of the design below is our response to that: a rebuild every week, a grade on every membership, and names that hold still while the members come and go.
Step 1: take the market out
The universe is every active common stock, ordinary share and ADR listed on a US exchange. Funds stay out, because an ETF moves with its holdings by construction and would top every correlation table. A stock needs 200 of the last 250 sessions to be clustered. A ticker that went silent for 20 sessions or more starts its history again. This matters when a new company inherits an old symbol: its chart arrives with months of somebody else's prices attached.
On a day the market falls 2%, nearly every stock falls. That day tells you nothing about which stocks belong together, and raw correlations are full of days like it. So for each stock we measure how much of its daily move the S&P 500 explains, subtract that part, and keep what is left. That leftover, the residual, is what every later step works on.
The left panel is 63 large stocks from eleven groups the pipeline found, correlated on their daily returns. Everything glows. Semiconductor equipment correlates with crypto, crypto with nuclear, banks with gold. The right panel is the same stocks after the market comes out and the matrix is shrunk, which is step 3. Correlation across groups falls from 0.32 to 0.09 and the groups stand out as blocks. Notice what still glows off the diagonal: gold with silver, and the three nuclear groups with each other. Those links come back near the end.
Step 2: split the market into five liquidity cohorts
Next we rank every stock by its average daily dollar volume over the last 20 sessions and cut the list into five cohorts of equal size. In mid-September, Micro topped out at about $400,000 a day, and Mega started at $74 million and ran up to about $29 billion.
We cluster each cohort on its own, for two reasons. A stock that trades $200 million a day and one that trades $100,000 do not share buyers, and once the market comes out, a micro-cap's residual is mostly its own news. Mixing them lets the noisy end blur the clean end. The second reason is arithmetic. With 5,700 stocks and 250 days there are about 22 stocks for every day of data, far too little evidence to pin down 16 million correlations. Cohorts of about 1,140 bring that to about 4.
The right panel shows what each cohort gives back. Liquid stocks cluster almost completely: 96% of the Mega cohort lands in a cohesive group, against 9% of Micro. We read that as a real result. Once the market is out, most micro-caps move with no group at all, and step 8 places the ones that do.
Step 3: shrink the noise, then build a tree
A correlation matrix over 1,100 stocks estimated from 250 days is mostly noise. Physicists showed in 1999 that most of the eigenvalues of a stock correlation matrix match what purely random data would produce (Laloux et al., 1999). Our data agrees: only 15 of the 1,088 independent patterns of co-movement in the Mega cohort are stronger than noise alone would give. Cluster the raw matrix and you get themes made of coincidence.
So we shrink it. The Ledoit–Wolf estimator pulls the sample matrix toward a simple, structured target, by an amount it estimates from the data itself (Ledoit and Wolf, 2004). The noisier the cohort, the harder it pulls: 70% of the way for Micro, 22% for Mega, as the right panel above shows.
Then we turn each correlation into a distance, so stocks that move as one sit at zero and unrelated ones sit far apart (the formula is √(2(1 − ρ))). Ward's method builds a family tree over the cohort by repeatedly joining the two groups that stay tightest once combined. The height at which a group joins the tree measures how alike its members move: lower means tighter.
Step 4: walk the tree instead of cutting it
The textbook move is to cut the tree at one height and call every branch below the cut a cluster. We started there. It fails, because themes form at different depths.
In the Mega cohort, the gold majors become a tight group at a height of 0.91. Semiconductor equipment comes together at 1.11, the four US money-center banks at 1.24 and the five big Canadian banks at 1.29. A cut low enough to keep semiconductor equipment apart from the rest of tech never forms the banks. A cut high enough to form the banks fuses dozens of clusters into their neighbors. The best single height still loses 104 of the 232 clusters in that cohort. When we ran fixed cuts in production, no bank theme formed at all, and the step that places leftover stocks attached 184 banks to the nearest group it could find: US passenger airlines.
So we walk the tree from the bottom up. A branch becomes a cluster when it holds between 3 and 150 stocks and the average correlation inside it clears 0.10. A cluster can grow, which is how it absorbs a stock that joins late. One rule makes the walk different from any cut: a branch that contains two clusters already accepted never becomes a cluster itself, however tight it measures. Semiconductor equipment freezes deep in the tree, the banks form higher up, and both survive.
That rule leans one way on purpose. If the walk splits a theme in two, the naming step can join the halves again. If it fuses two themes, nothing downstream can pull them apart.
Step 5: check that every Core member fits best where it sits
The walk judges groups, so a stock can get into one on the strength of a single partner while barely moving with the others. Microsoft once landed in the core of a four-stock group that went on to be named as speculative micro-caps. Against the other three it scored a correlation of 0.22. Against the center of the group holding Salesforce, ServiceNow, Atlassian and Veeva it scored 0.50.
Now every Core member gets scored twice: against its own group with itself left out, and against every other group's center. If another group fits better by more than 0.2, the stock loses its Core seat and goes back into the pool for step 8. On one weekly snapshot this demoted 140 of 2,079 Core members and dissolved 30 groups that fell below three stocks.
Step 6: name what the math found
Only now does a language model see the groups.
For each cluster, the model gets the Core tickers with each company's name,
industry code and own description, under one line: "These N stocks are highly
correlated:". It never sees a price, a return, a correlation or the cohort. Its
job is to choose a key from our taxonomy of 73 themes, from
precious-metals-miners to quantum-computing, and to write one sentence on
why these stocks move together. If nothing fits, it may propose a new theme,
and the prompt tells it that should be rare.
The model picks the key; our code writes the label. Whenever the model returns a taxonomy key, the theme's name comes from our own list, so a theme reads the same way every week. Before the taxonomy, 54 runs produced 473 distinct theme names, and nearly half of them appeared once and never again. Uranium miners went by three names and speculative micro-caps by about 80. A name that changes every week cannot carry a year of history, an alert or a saved scan.
The figure shows the nuclear example from the top of this post. One cohort produced three clusters: the uranium miners, the advanced reactor developers, and the power producers selling to data centers. By industry code, Centrus is a miner and Oklo is a utility like Vistra. By price, Centrus and Oklo trade with NuScale, and the model names the three groups apart.
Two more passes follow. The second takes the rare clusters that proposed a new theme, all in one call, and either maps each one to the taxonomy or groups true duplicates under one name. A proposal that keeps coming back is how we decide the taxonomy needs a new entry. The third translates every description into seven languages in parallel, under a 90-second budget. A language that misses the budget stays in English, and a cluster that failed to get a name is retried in a clean-up pass after the run.
The model is only as good as the descriptions it reads, and one week they let
it down. It filed a group of bitcoin miners that now rent much of their power to
AI customers under plain bitcoin mining. Two things misled it: company
descriptions years out of date, and a line in our own taxonomy saying miners
moving into AI hosting still counted as miners. The clustering had kept the two
groups apart in 10 of 12 weekly runs; the names had put them back together. We
refreshed the descriptions, rewrote that taxonomy entry and added
ai-datacenter-hosts.
Step 7: merge clusters that share a key
Clustering each cohort on its own has a cost. A theme that spans the liquidity range arrives in pieces: the gold majors in Mega, the mid-tier producers in Large, the explorers and smaller royalty companies further down.
The model names each piece separately, and every piece that holds gold producers comes back with the same key. The merge folds them into one theme. Members keep their best grade, and the theme records that it spans cohorts, as about a quarter of themes do. A cluster the model failed to name never merges with anything, because a missing name is no evidence that two groups are the same.
Step 8: grade everyone else
After the merge, more than half the universe still sits outside any Core. For each theme we compute a center, the average daily residual of its Core members. Every other stock is scored against every center and keeps its best fit.
A best fit of 0.45 or more makes the stock a Satellite of that theme. Between 0.25 and 0.45 it joins as Loose. Below 0.25 it joins nothing, which is the honest answer for most micro-caps.
Score a stock against nearly 200 themes and one of them will fit fairly well by luck alone, so the best fit also has to beat chance. We tested this with shuffled price series. With a full year of history, a random series cleared 0.25 against its best theme 7% of the time. With under 120 sessions it cleared that bar between 71% and 100% of the time. Now the bar rises as a stock's history shortens: 0.22 with a full year, 0.31 with 120 sessions and 0.43 with 60.
The grades change what you see:
| Grade | Rule | Weight in return | In scans by default | Shares top industry |
|---|---|---|---|---|
| Core | In a cohesive cluster, and fits it best | 1.0 | Yes | about 60% |
| Satellite | Best fit 0.45 or more, beats chance | 0.5 | Yes | 65% |
| Loose | Best fit 0.25 to 0.45, beats chance | 0 | No | 34% |
| Stocks picked at random | for comparison | about 4% |
Core is what the theme's name describes, and Satellites trade in sympathy with it. Loose members appear in the theme's list but stay out of its return and, by default, out of scans; the Depth control in the scanner lets you choose.
The last column checks the grades against industry codes, which the clustering never sees. The 35 to 40% of Core and Satellite members outside their theme's top industry are where a theme says something an industry code cannot, like Centrus sitting with the reactor developers. Some of them are noise, which is what the grades and the weekly rebuild are for.
How themes connect
A theme connects in three directions. Across cohorts, the merge in step 7 joins the pieces. Across weeks and across other themes, two more mechanisms take over.
Across weeks, the key does the work. We never reuse a key, so a theme keeps its name, its color and its history while its members change. And they do change: take the members in both weeks and divide by the members in either, and the typical theme scores about 72%. Some of that churn is the market moving and some is estimation noise. Two choices keep either from misleading you. Theme relative strength comes with a 20-session slope that holds today's basket fixed, so a theme cannot look like it is fading because we reclassified it (more on Theme Overview). And a scan run as of a past date uses the theme map that was in force on that date.
Across themes, a stock can belong to two. Our first version placed each stock in exactly one theme, and that was wrong: a memory maker trades with memory makers, and also with the companies that sell chip-making equipment. Now any stock, Core members included, can join a second theme as a Satellite when its fit there is 0.45 or more, beats chance, and comes within 0.10 of its best fit (second themes on ticker pages). In one replay that added 881 second memberships to 4,070 primary ones. The most common pairs were gold with silver, independent oil producers with the integrated majors, homebuilders with building products, and enterprise software with cybersecurity.
The figure shows those links for the twelve themes in our Theme Solar System, from the run of 4 October. Micron and SanDisk are Core in Memory & Storage and Satellites of Semi. Cap Equipment. NuScale is Core in Advanced Nuclear and a Satellite of Quantum Computing, and Nano Nuclear goes the other way. Nebius and CoreWeave are Core in AI & GPU Cloud and ride along with the AI datacenter hosts. A map that gives each stock a single sector cannot express any of this.
You will also see names like ARM and Marvell in the Core of Semi. Cap Equipment, and AMD and Intel in the Core of Analog/Mixed-Signal. A theme's name describes the business most of its Core shares, and every Core member trades like that group, whatever it sells. Over the last year, ARM's stock traded with the equipment makers, so that is where the map puts it.
From a weekly map to a live number
The classification runs once a week, and everything downstream reads the same memberships. As soon as a run lands we copy it to our serving database and the live engine reloads its membership snapshot. During the session that engine recomputes every theme's return every 30 seconds, as the average of its members' returns with Core weighted 1.0 and Satellites 0.5. It computes two copies per tick: one live, and one built entirely from 15-minute-old prices for plans that see delayed data. Each return compares the current price with the previous close, and both now come from one price series. When they came from two, a single bad print turned a 3.8% day for semiconductor equipment into 17.6%.
Every weekday evening a batch job settles the day: the final return, dollar volume, order-flow and volatility features, and relative strength as both today's level and the fixed-basket slope. It recomputes a full year of history every evening, so a repaired price heals every theme it touched. Those numbers feed Theme Performance, Theme Overview, the 3D Theme History heatmap, Theme Motion, the theme row on every ticker page, the scanner's theme universe, the AI terminal and the API.
Where this approach falls short
Building themes from prices gets a lot right, and it gets some things wrong in ways you should know before you trade on them.
The market's leaders have no theme. Look up Apple, Nvidia or Alphabet and you will find no theme at all. The S&P 500 weights companies by size, so the largest ones make up a big share of the market we subtract in step 1. Take the market out of Nvidia and you have taken out part of Nvidia, and what is left is mostly its own news: earnings, product launches, regulators. Nothing else trades with that. Once the market comes out, Apple's closest partner among the most liquid stocks correlates at 0.17, and so does Tesla's. Micron's correlates at 0.64.
None of Nvidia, Apple, Meta, Amazon, Tesla or Alphabet fits any theme well enough to be a Satellite. Microsoft and Broadcom only just clear that line, and in the October run Microsoft is a Satellite of Enterprise SaaS and Core nowhere. We think that is the right answer, and we would rather show it than paper over it with a hand-picked AI theme. Each of these companies is a theme of one, and the nearest thing to its group is the index it helps move. To judge whether Nvidia is leading or lagging, compare it with the S&P 500 rather than with a basket.
Most micro-caps have no theme either. Only about one Micro stock in ten forms a cluster, and more than half of the cohort fits no theme at all. That is real: once the market is out, a stock that trades a few hundred thousand dollars a day moves on its own news, and a theme scan will not find it.
A year of history makes the map slow to notice change. Every correlation uses the last 250 sessions, so a stock that started trading with a new crowd a month ago has about 20 sessions of new behavior against 230 of old. It drifts toward its new group over weeks and months, not overnight. New listings wait longer. A stock needs 200 sessions to be Core, so for most of its first year a new listing can join a theme only as a Satellite or Loose member, and only by clearing the higher bar for short histories from step 8.
Some themes are crowds rather than industries. Co-movement can come from the same buyers as easily as from the same business. Quantum computing, small modular reactors and air taxis have little in common as businesses, yet NuScale and Joby both show up as Satellites of Quantum Computing. A theme's name describes what its Core companies do; what holds the group together can be appetite for risk. The taxonomy keeps a last-resort entry, speculative micro-caps, for groups that share nothing else, and the dashboard's theme cards hide it by default.
What you can do with it
On Monday morning the map is a week old at most. Open a ticker page and you see which theme it trades with this week, and how firmly. Sort Theme Overview by the relative-strength slope and you see which groups are gaining with their members held fixed. And when a stock starts trading with a new crowd, the map follows it there on its own, with no editor in the loop.
In the scanner, a theme is part of the universe, next to exchange, security type and country. Open the gear beside the Scan button, expand Themes, search for the ones you want and switch them on. Pick two and the scan covers the members of both, and anything you set under exchange, security type or country narrows it further. Every filter you add then runs on those stocks alone, so a scan for oversold names becomes a scan for oversold nuclear names. A saved scan stores the theme rather than its tickers, so each run uses that week's members.
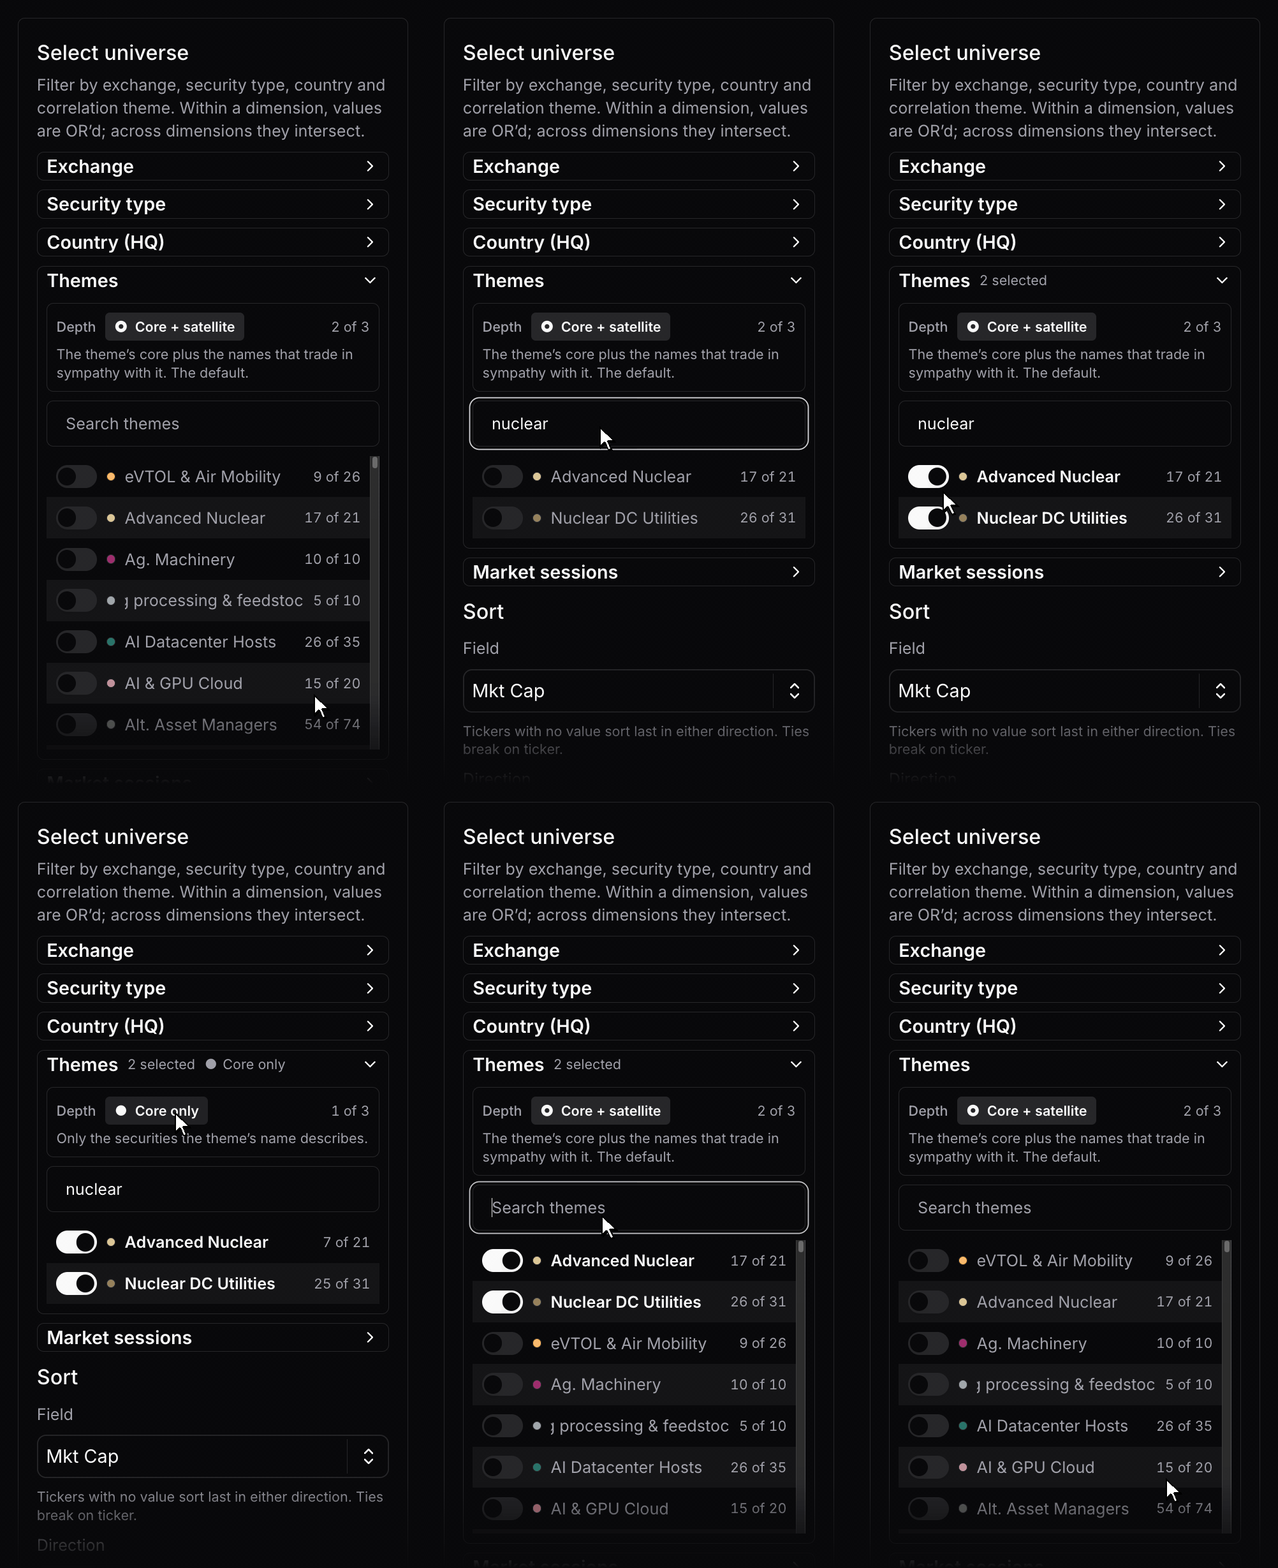
The Depth control above the list sets how far into each theme the scan reaches: Core only, Core + satellite (the default), or every member down to Loose. The count on each row moves with it. Advanced Nuclear reads 7 of 21 at Core only, 17 of 21 at the default and 21 of 21 at full depth. Theme scans are part of the Super and Super Pro plans.
Fly through it
Every theme in this post lives in the Theme Solar System. Each planet is a theme, sized by the money that trades in its stocks each day. Its moons are its most-traded Core members, orbiting closer the more they have beaten the S&P 500 over six months, and its spacecraft are Satellites, two in three of them Core somewhere else. Scrub from January 2022 to September 2026 and watch Quantum Computing grow sixteen-fold in 2024, or Memory & Storage reach $69 billion a day, 22 times its size at the start. From any planet, one tap opens that theme in Theme Overview.
Questions about the method, or a theme you think we are missing: [email protected].
— Eoin & The Scanr.ai team